- Similar to other organizations nationwide and in the national capital region, WMATA’s operating costs have risen with inflation, including at historic levels during the pandemic.
- Although compensation for a majority of employees must adhere to collective bargaining agreements (CBAs), Metro has implemented several cost saving measures and streamlined inefficient processes.
- From FY18-24, Metro cut administrative costs by $308M through healthcare cost-sharing, maximizing real estate assets, office consolidation, position eliminations, and reducing the non-revenue fleet.
- Metro is providing more service per revenue mile with fewer budgeted operating positions than 2016.
- To help close the FY25 operating budget gap, Metro is proposing $117M in expense reductions:
- $50M in newly identified recurring operating cost efficiencies.
- $38M in salary and wage freezes (assumes 0% increase for Non-represented, Local 689, and Local 922 employees)
- $18M in targeted service cuts while maintaining quality service and limiting customer impacts. These include more limited hours of peak period service, frequencies, and reduction of the lengths of trains.
- $11M by reducing the FY25 inflation assumptions for non-personnel expenses
- Cost reduction efforts are already well underway. On January 8, 2024, Metro implemented a hiring freeze, and reduced the length of the newest 7000 series trains, which will reduce maintenance costs and energy expenses.
- As a result of the proposed changes, Metro’s FY25 operating expenses would be reduced by $117M, or about 5% from the original June budget projection of $2,575M. This potential regional solution to FY25 would restrict the annual growth of Metro’s operating expenses to 0% from FY24 budgeted levels. In other words, Metro can freeze operating expenses at FY24 levels for the FY25 budget.
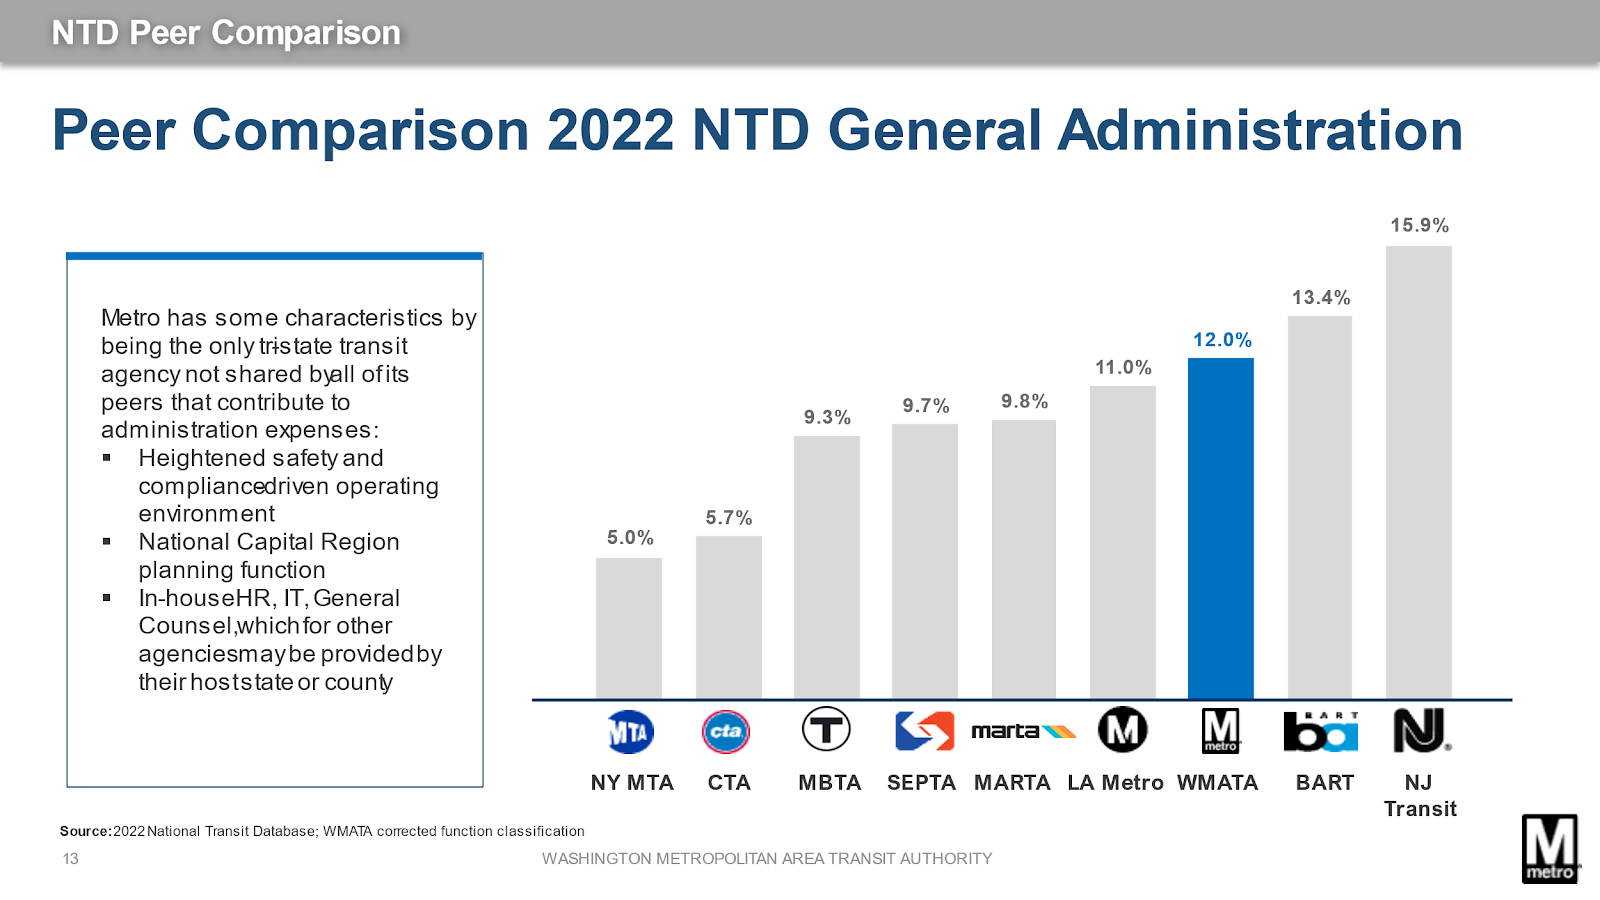
- Using a peer comparison from 2022 data, Metro’s total operating general administration headcount was 12%, which is consistent with its nationwide transit peers. Metro has unique characteristics that are unlike many of its peers including heightened safety/ compliance costs, in-house functions such as IT and legal while other systems may use their host state or county, and serving as a planning body for a tri-state regional area including Virginia, Maryland, and the District of Columbia.
- Since 2019, Metro’s operating budget growth has averaged 4.8%, close to the CPI-W 5-year average of 4.4% and below the regional peer average of 7% and peer average of other transit systems.
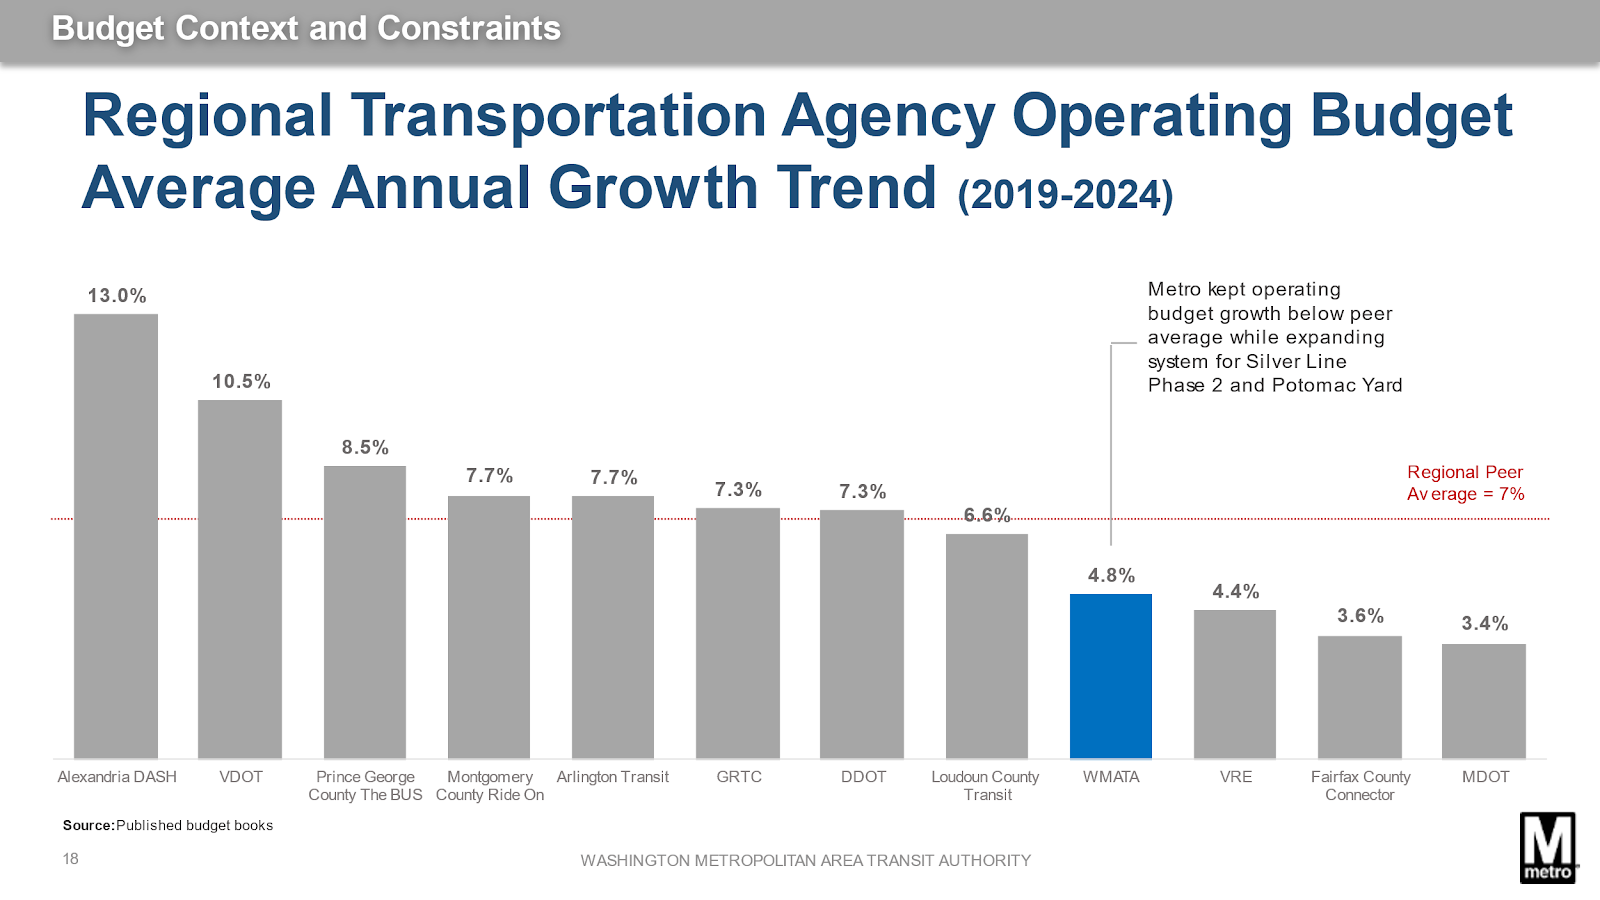

Photo credit: Low Clouds and Coastal Fog